
Quantifying Model Benefits
While making decisions in complex environments, humans typically rely on approximations. For example, while dealing with time-varying demand, a manager might use the average demand for ease of planning. However, plans so developed tend to under-perform during execution when the real values shows up in a random way. One way to measure the effectiveness of our models is to measure the difference between the model-generated solutions for ‘averaged’ inputs versus ‘actual’ inputs. This is only a rough metric based on simulated data. For a real comparison, we would need to compare the model solutions with the solutions from the existing methods used by a company. In fact, it is possible that even the model generated solutions for 'averaged' inputs could be an improvement over the solutions obtained by a company from its existing methods.
Vehicle Routing Model
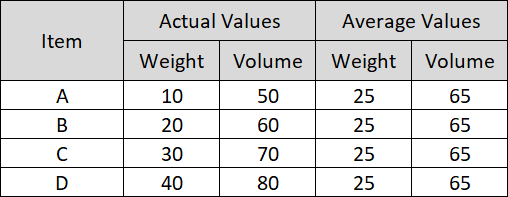
Every item in a warehouse has a specific weight and a specific volume. Also, a vehicle can only carry up to a certain weight and up to a certain volume of items. If a planner uses an average item weight and an average item volume (say because of ease of planning), then the planner is going to consistently underestimate the no. of vehicles needed to pick a set of orders. This means that in reality, the vehicles are going to pick fewer orders than what was planned for. In our tests, we found that the percentage reduction in the no. of orders actually picked can be up to 10% (?). The Vehicle Routing model uses actual item weight and volume, thereby eliminating such reductions.
Project Scheduler
If a planner uses models that do not adequately model change-over times, then the planner might divide the change-over times into groups (say low, medium and high) and then generate plans using the average change-over time (for each group) and not the actual change-over time. This results in a consistent under-estimation of the time taken to finish all jobs (make-span), which contributes to project delays during execution. In our tests, we observed a make-span underestimation of up to 10% (?). The Project Scheduler uses the actual change-over times and thus avoids this issue.
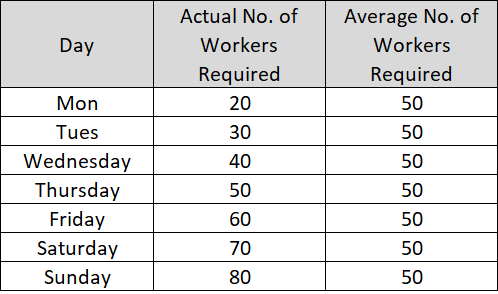
Facility-based Quarterly Planner
The Quarterly Planner creates a staffing plan that provides for each facility an adequate no. of workers for every day of every week of a quarter. Let us assume that the daily worker requirements at a facility vary during the week. For a given facility, one can create a plan either by using the actual daily worker requirements or by using for each day of a week a value equal to the average weekly requirement for that week and facility. If a planner does the latter, then the staffing plan will have a shortfall of workers on some days. In our tests, we found that the fraction of days with a shortfall can be as high as 10% (?). The Quarterly Planner uses the actual daily values and thereby avoids such a shortfall.
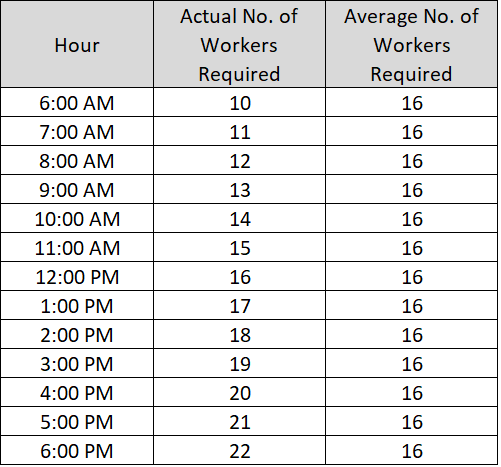
Weekly Planner
The Weekly Planner creates a staffing plan that provides for each facility an adequate no. of workers for every hour of every day of a week. Let us assume that the hourly worker requirements at a facility vary during the day. For a given facility, one can create a plan either by using the actual hourly worker requirements or by using for each hour of a day a value equal to the average daily requirement for that day and facility. If a planner does the latter, then the staffing plan will have a shortfall of workers in some of the hours. In our tests, we found that up to 30% of the hours can have a shortfall. The Weekly Planner uses the actual hourly values and thereby avoids such a shortfall.
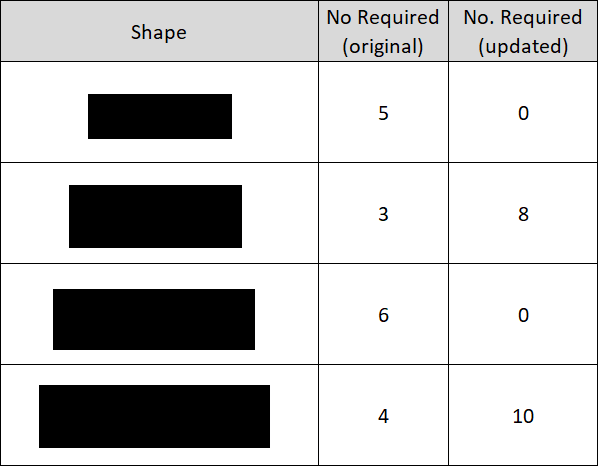
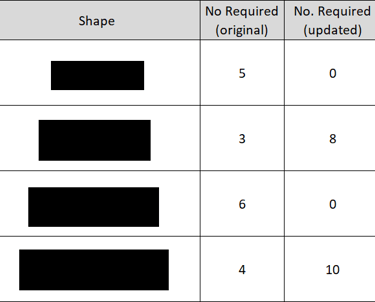
Sheet Cutting Optimizer
If a person needs to deal with a diverse set of small shapes, then they may (a) group similar shapes together, (b) use the largest shape in that group as the representative value of that group, and (c) solve the resulting smaller problem to get the adequate no. of representative shapes from the larger sheet. This approach tends to overestimate the no. of large sheets required for getting the adequate number of smaller shapes. In out tests, an over-estimation of up to 10% was noticed. The Sheeting Cutting Optimizer avoids this approximation and prevents such an over-estimation.